In Microservice architecture, the calling chain is long and complex, to understand each component and the performance of it, you need something called distributed tracing. The idea is simple, you generate a unique ID at the beginning of each request, and carry it along the whole calling chain. The ID is called Correlation ID¹ and you can use it to trace the performance of the entire request. There are two problems need to be solved. First, how to make the ID available to every function you need to trace inside your application; second, how to pass the ID across the network when you need to call another Microservice.
What is OpenTracing?
There are many tracing libraries, among which the most popular ones probably are “Zipkin”² and “Jaeger”³. Which library do you choose? That is always a headache because you can choose the most popular one at the moment, but what if later on there is a better one coming out? OpenTracing⁴ tried to solve the problem by creating a common interface for tracing libraries, so you can switch to a different implementation library in the future without changing your code.
How to trace server endpoints?
In our application, we use “Zipkin” as the tracing library and “OpenTracing” as the generic tracing API. There are usually four components in a tracing system, and I use Zipkin as an example:
Recorder: which will record the trace data
Reporter (or collecting agent): which collects the data from a recorder and send the data to UI app
Tracer: which generates the trace data
UI: which is responsible for presenting trace data in a graphic UI
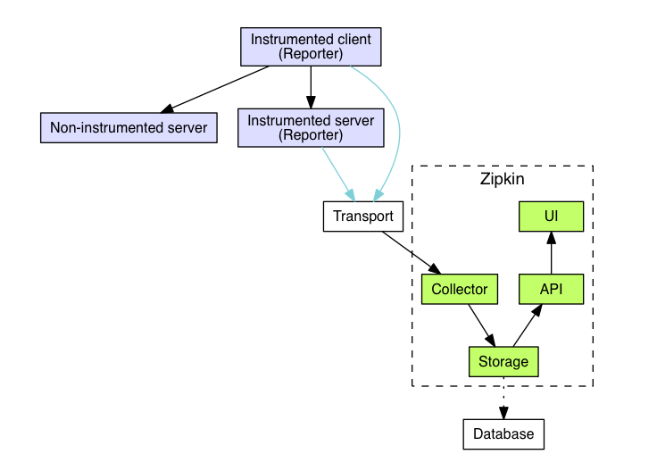
The above is the component diagram of Zipkin, and I took it from “Zipkin Architecture”⁵.
There are two different types of tracing, one is in-process tracing and the other is cross-process tracing. We will talk about cross-process tracing first.
The client side code:
We will use a simple gRPC program as an example, which has client side and server side code. We’d like to trace a request from the client side to the server side and return back. The following is the code to create a new tracer on the client side. First it creates the “HTTP Collector” (the agent), which collects the tracing data and sends it to the “Zipkin” UI. The “endpointUrl” is the URL for “Zipkin” UI. Second, it creates a recorder to record the information on an endpoint, the “hostUrl” is the URL for gRPC (client) call. Third, it creates a new tracer with the recorder we just created. Finally, it sets the “GlobalTracer” for “OpenTracing”, which can be accessed in the whole application.
|
|
The following is the gRPC client code. It first calls the function “newTrace()” mentioned above to create the tracer, then, it creates the gRPC connection which includes the newly created tracer. Next, it creates the cache service gRPC client with the connection just created. Finally, it makes the “Get” call to the cache service through the gRPC client.
|
|
Trace and Span:
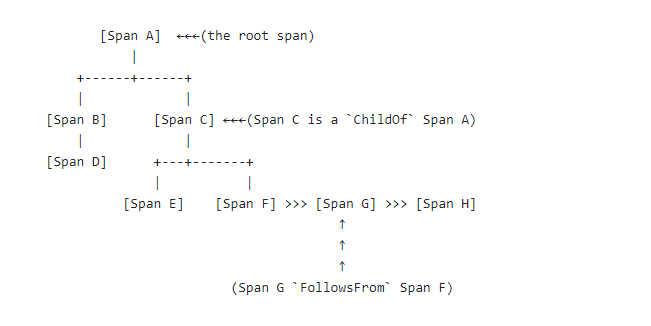
In OpenTracing, an important concept is called “trace”, which represents one calling chain of a request from beginning to end and the identifier is “traceID”. Under a trace, there are many spans, each captures a unit of work inside the calling chain and it is identified by “spanId”. Each span has one parent and all spans of a trace formed a directed acyclic graph(DAG). The following is the diagram of the relationships among spans. I took it from “The OpenTracing Semantic Specification”⁶.
The following is the function “callGet”, which makes a call to the gRPC server. At the beginning of the function, it starts a span for this function call and at the end, it finishes the span.
|
|
The server side code:
The code is similar to the client side code, it also calls “newTracer()”(which is almost the same with the client side “newTracer()” function) to create a tracer. Then, it creates a “OpenTracingServerInterceptor”, which has the tracer inside it. Finally, it creates the gRPC server with the interceptor we just created.
|
|
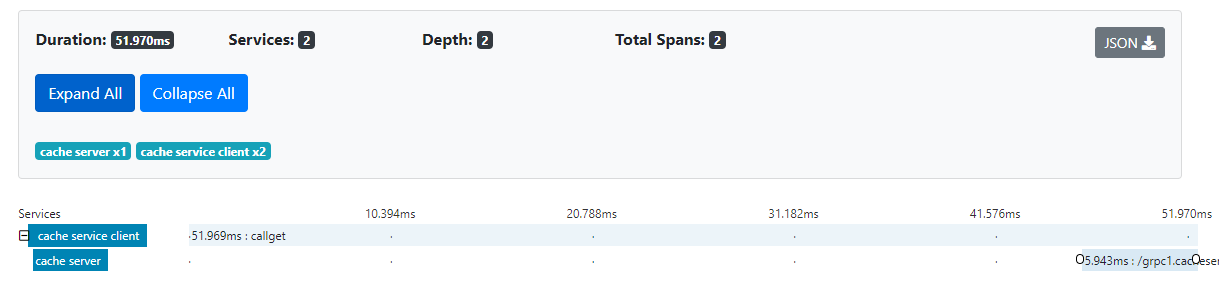
The following is the picture of the trace and the spans in Zipkin after you run the above code. One the server side, we didn’t need to write any code inside a function to generate the span, all we need to do is to create a trace and the server interceptor automatically generates the call span for us.
How to trace inside a function?
The above picture didn’t give us what is going on inside a function. We need to write some code to do it.
The following is the server side “get” function and we added trace code. It first gets the span from the context and then creates a new child span and using the one we just get as the parent span. Next, it does some action (for example, a database query) and then finishes the child span.
|
|
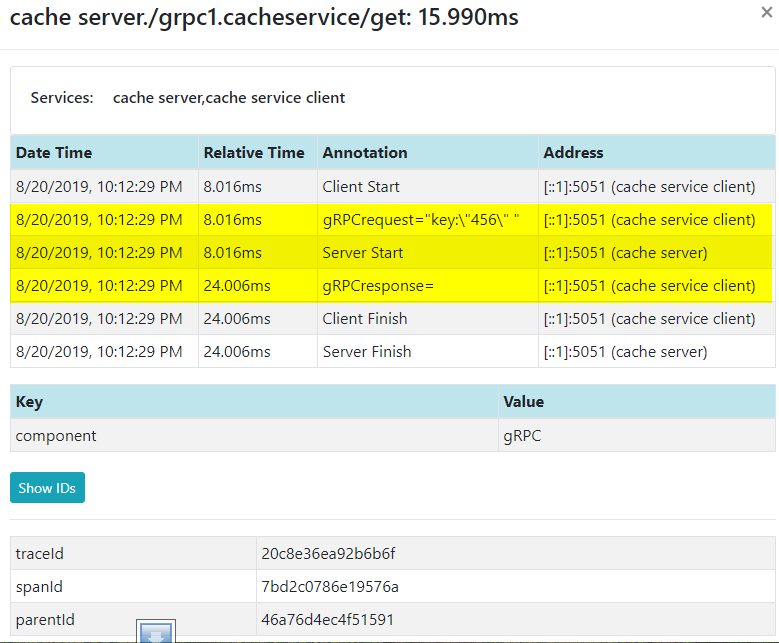
The following is the picture of it. Now it has a new span “db query user” on the server side, which we just added.
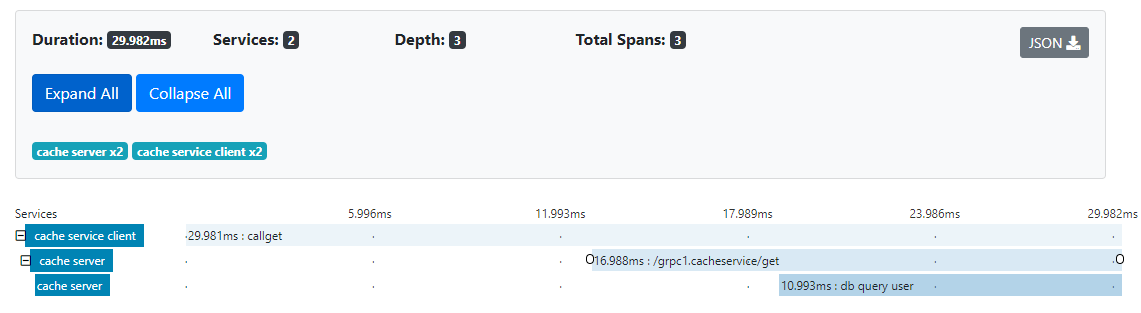
The following is the data for it. You can see the client starts at 8.016ms and the server starts at the same time. It takes about 16ms for the server side to finish.
How to trace a database?
What if you need to trace what is going on inside the database call? Then, database driver needs to support tracing and you need to pass the tracer into the database. What if the database driver doesn’t support tracing? There are several driver wrappers, which can wrap any database driver and make it supporting tracing. One of them is “instrumentedsql”⁷ (The others are “luna-duclos/instrumentedsql”⁸ and “ocsql/driver.go”⁹). I briefly looked at the code of them and they all using the same approach. Basically, they all create a wrapper for each function of the underlying database and start a new span before each database operation and finish the span after the operation is done. However, all of those wrapped around “database/sql” interface, so no luck for NoSQL database. If you can’t find a driver supporting OpenTracing for your NoSQL database, you may need to write a wrap. It shouldn’t be difficult to do though.
One question is “If I use OpenTracing with Zipkin and the database driver use OpenTracing with Jaeger, will that work? It turned out that won’t happen. Most of the wrapper I mentioned above supporting OpenTracing. In order to get the wrapper work, you need to register the wrapped SQL driver, which has the tracer in it. Inside the wrapper, all tracing functions are called on the OpenTracing interface, so it doesn’t even know whether the underlying implementation is Zipkin or Jaeger. Now, you see the benefit of using OpenTarcing. When you create the global tracer in your application, you do need to decide whether to use Zipkin or Jaeger, after that, each function in your application or third party libraries only call the OpenTracing interface and everything will work.
How to trace a client call?
Let’s say we need to call a RESTFul service in our gRPC service, how to trace that?
A simple answer is to use the HTTP header as the media to carry out the trace information. No matter the Microservice is gRPC or RESTFul, they all use the HTTP protocol. If it is a message queue, then put trace information in the message header. (There are two different types of headers for Zipkin B3-propogation, “single header” and “multiple header”, but JMS only supports single header)
On important concept is “trace context”, which defines all the needed information to propagate a trace, such as traceID, parentId (parent spanId) and so on. For more information, please read “Trace Context”¹⁰.
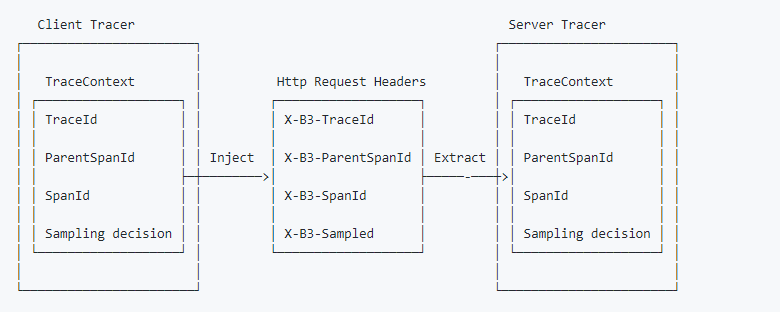
OpenTracing provides two functions to propagate the trace context: “extract(format, carrier)” and “inject(SpanContext, format, carrier)”. “extarct()” retrieves the tracing context from a carrier, usually it is HTTP header. “inject” puts the tracing context into a carrier, so the tracing chain won’t broke. The following is the diagram for “b3-propagation”, which I took from Zipkin.
But why didn’t we call those functions in our example? Let’s review the code. On the client side, when creating the gRPC client connection, we called a function named “OpenTracingClientInterceptor”. The following is the partial code for “OpenTracingClientInterceptor”, which I took from “client.go” in “otgrpc”¹¹ package. It gets the trace context from the Go context¹² and inject it into HTTP header, so we didn’t need to do it manually.
|
|
On the server side, we also called a function “otgrpc.OpenTracingServerInterceptor”, the code of which is similar to the client side “OpenTracingClientInterceptor”. Instead of injecting trace context, it extracts the trace context from the HTTP header and put it into Go context. That is why we don’t need to manually call “extract()” again. In our code, we can directly extract the trace context from the Go context (opentracing.SpanFromContext(ctx)). But for other HTTP based service such as RESTFul service, that may not be the case, so we need to explicitly extract the trace context from HTTP header on the server side. Of course, you can use an Interceptor or a filter as well.
The interoperability between trace libraries
One question is “If I use OpenTracing with Zipkin and the third party Microservice using OpenTracing with Jaeger, will that work?” It looks similar to the database question we asked before, but they are very different. For the database one, because the application and the database are in the same process, they can share the same global tracer, so it is much easier to solve. For the Microservice one, generally speaking, it won’t work because OpenTracing only standardized the tracing API and it didn’t standardize on the trace context. The World Wide Web** **Consortium (W3C) is working on a standard for “trace context”¹⁰, and it published a candidate recommendation on 2019–08–09. OpenTracing lets the vendor to decide which trace context they use. It seems each vendor choosing its own trace context. For example, Zipkin uses “X-B3-TraceId” as the trace ID and “Jaeger” uses “uber-trace-id”, so implementing OpenTracing doesn’t mean that a trace library can interoperate with another one across the wire. One good news for “Jaeger” is that you can choose to use “Zipkin compatibility features”¹³ to generate Zipkin trace context when you create a Jaeger tracer, then they will be compatible with each other. For other situations, you need to do the manual translation (between the extract and the inject) yourself.
The design of tracing
Write less code for tracing
One requirement for tracing should be coding tracing as less as possible. Ideally, you don’t need to any code and a framework or library will take care of it. There are three levels of tracing:
cross-process tracing
database tracing
in-process tracing
It turned out that cross-process tracing is the easiest one. You can write a interceptor or a filter to trace every request, only minimum coding involved. Database tracing is also fine. If using the wrapper we talked above, you only need to register the driver wrapper and need to pass in go-context (to database functions), which has trace context inside. You can use Dependency Injection to do it with minimum coding.
In-process tracing is the most difficult one because you have to write tracing code for each individual function. I am not aware a good way to write a generic function to trace every function in an application. (Interceptor won’t be a good choice because it needs every function has a generic type (interface{}) for parameters and returns). Fortunately, the first two levels probably is good enough for most people.
Some people may implement distributed tracing with service mesh, such as Istio or Linkerd. Tracing is best implemented by infrastructure and rather than be mixed with your business logic code. You will face the same problems we just talked though. The service mesh will take care the cross-process tracing, but you still need to do in-function or database tracing yourself. Some service meshes make it easier to propagate the trace context through the wire by providing integration with popular tracing vendors.
Trace Design:
Carefully designed span, service name, tags play an important role in fully utilization of tracing power. please read “Semantic Conventions”¹⁴ for detail.
Logging Trace ID
It is a common requirement to integrate tracing with logging, basically to log the trace ID in logging message along a calling chain. Currently, OpenTracing doesn’t expose traceID. You can either convert the “OpenTracing.SpanContext” to vendor specific “SpanContext” (both Zipkin and Jaeger exposed traceID through their “SpanContext”) or convert the “OpenTracing.SpanContext” to a string and parse it to get the traceID. Converting to a string is better because it won’t mess up your dependency. You don’t need to worry about it in the future because OpenTracing will expose traceID, please read here.
OpenTracing and OpenCensus
OpenCensus¹⁵ is not another tracing interface, but a collection of libraries can integrate with other tracing libraries to finish the tracing job, so it is often compared with OpenTracing. The question is “If I use OpenTracing in my application and need to access the database which uses OpenCensus, will that work?” No, it won’t. So, you need to be careful when choosing tracing interface to make sure it is supported by other libraries you need. A good news is that you don’t need to make the choice in the future because they will “merge the project into one”¹⁶, and the problem is gone.
Conclusion:
Distributed tracing includes different scenarios, such as tracing inside a function, database tracing and cross-process tracing. If you want to design a better tracing solution or choose the best fit tools or libraries for your use case, you need to be aware of issues and solutions in each scenario.
Source Code:
The complete code is in github: https://github.com/jfeng45/grpcservice
Reference:
[1]Correlation IDs for microservices architectures https://hilton.org.uk/blog/microservices-correlation-id
[2]Zipkin https://zipkin.io
[3]Jaeger: open source, end-to-end distributed tracing https://www.jaegertracing.io
[4]OpenTracing https://opentracing.io/docs/getting-started
[5]Zipkin Architecture https://zipkin.io/pages/architecture.html
[6]The OpenTracing Semantic Specification https://opentracing.io/specification/
[7]instrumentedsql https://github.com/ExpansiveWorlds/instrumentedsql
[8]luna-duclos/instrumentedsql https://github.com/luna-duclos/instrumentedsql
[9]ocsql/driver.go https://github.com/opencensus-integrations/ocsql/blob/master/driver.go
[10]Trace Context https://www.w3.org/TR/trace-context/
[11]otgrpc http://github.com/grpc-ecosystem/grpc-opentracing/go/otgrpc
[12]Go Concurrency Patterns: Context https://blog.golang.org/context
[13]Zipkin compatibility features https://github.com/jaegertracing/jaeger-client-go/tree/master/zipkin
[14]Semantic Conventions https://github.com/opentracing/specification/blob/master/semantic_conventions.md
[15]OpenCensus https://opencensus.io/
[16]merge the project into one https://medium.com/opentracing/merging-opentracing-and-opencensus-f0fe9c7ca6f0
Translations
See also
- Go Microservice with Clean Architecture
- Go Microservice with Clean Architecture: Application Logging
- Go Microservice with Clean Architecture: Application Layout
- Go Microservice with Clean Architecture: Application Container
- Go Microservice with Clean Architecture: Dependency Injection